Maybe you’ve seen or heard the words “Fibonacci”. This word often appears in the world of trading, including Forex trading. Fibonacci numbers are numbers that are arranged according to a specific formula to create a unique numerical sequence. Within the sequence lies the ‘Golden Ratio’ 1.618, which appears frequently throughout the universe and is also widely used in technical analysis, along with other Fibonacci numbers and ratios, to help identify areas of support and resistance.
The main points of discussion of the application of Fibonacci in financial markets:
- Fibonacci Basics, Application in Nature Around Us
- Fibonacci: Math
- Application of Fibonacci in Financial Markets
Fibonacci Fundamentals, Application in Nature Around Us
The Fibonacci numbers get their name from the Italian mathematician who discovered them, namely ‘Leonardo Fibonacci’ in the thirteenth century. While his book “Liber Abaci” introduced the sequence of numbers to the Western world, traces of it can be found as far back as 200 BC in Indian mathematics.
Read Too :
- Premium Binary Bot Free Downloads – Higher Lower Bot 2022
- Binary Bot XML – G7 Analyzer Digits Over Under Bot 2022
- Binary Trading Bot Downloads – No martiangle PUT CALL 2022
- Digit Differ Bot Free Downloads – Differ Twin XX YY Wih Martiangel 2022
The sequence of numbers starts with 1 and each number in the sequence can be obtained by adding the two previous numbers in the sequence.
Fibonacci Series: 0.1,1,2,3,5,8,13,21,34,55,89,144,233,377,610,987,1597,2584,4181,765,1094,17711
Fibonacci In Nature:
Sunflower seeds have a very unique spiral arrangement pattern. Then in the math section, we discuss the spiral features of the Fibonacci sequence. Also, sunflowers tend to have a total of 34 spirals, Fibonacci numbers.

Golden sunflower close up (Nature and Landscapes) sunflower, yellow, spiral, plant, nature, flower
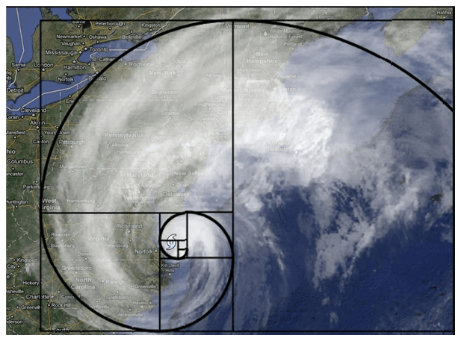
As another example, extreme weather patterns tend to form spirals, therefore, the structure consists of Fibonacci.
Other examples where Fibonacci numbers can be observed include: music, art (in the Mona Lisa), architecture and biology. Take a look at your hands and see that you probably have eight fingers, five on each hand, three bones in each finger, two bones in each thumb and one thumb on each hand (8, 5, 3, 2 , 1, 1).
Read Too :
- Premium Binary Bot Free Downloads – Higher Lower Bot 2022
- Binary Bot XML – G7 Analyzer Digits Over Under Bot 2022
- Binary Trading Bot Downloads – No martiangle PUT CALL 2022
- Digit Differ Bot Free Downloads – Differ Twin XX YY Wih Martiangel 2022
Fibonacci: Math
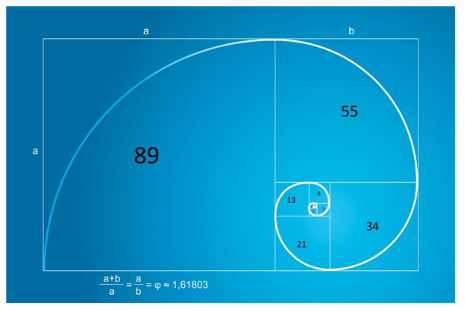
The diagram below shows a visual representation of the Fibonacci spiral, which is often seen in nature, when applying it to area calculations. For example, the spiral starts from inside a 1×1 square (the first Fibonacci number is 1), then moves to another 1×1 square (the second Fibonacci number is also 1), before moving to a 2×2 grid (the third Fibonacci number) and so on. Spirals are seen when connecting each additional square by drawing a curved line through the diagonal of each new square.
The Fibonacci numbers themselves are quite significant, but when analyzing the ratios that exist between an infinite sequence of numbers, the true value of Fibonacci becomes clear.
Golden Ratio:
Pick a number at random in the sequence and divide by the previous number and the answer is 1.618, or close to this number for the numbers from 1 to 55 in the sequence. It is often referred to by the Greek letter “Phi”.
Example:
a/b =
17711/10946 = 1.61803
6765/4181 = 1.61803
21/13 = 1.6154 (slightly below estimates for 55 and lower)
Application of Fibonacci in Financial Markets
While the application of Fibonacci in nature keeps math students very busy, traders have a more pressing problem: Applying the study to financial markets. In its most general form, Fibonacci uses mathematically relevant ratios to project possible support and resistance areas/zones.
Read Too :
- Premium Binary Bot Free Downloads – Higher Lower Bot 2022
- Binary Bot XML – G7 Analyzer Digits Over Under Bot 2022
- Binary Trading Bot Downloads – No martiangle PUT CALL 2022
- Digit Differ Bot Free Downloads – Differ Twin XX YY Wih Martiangel 2022
See the USD/SGD daily chart below as an example of where the Fibonacci retracement instrument has been applied to a significant move (bottom up). To reduce clutter on the chart, you’ll only see the 0, 38.2, 50, 61.8 and 100 percent markers displayed.
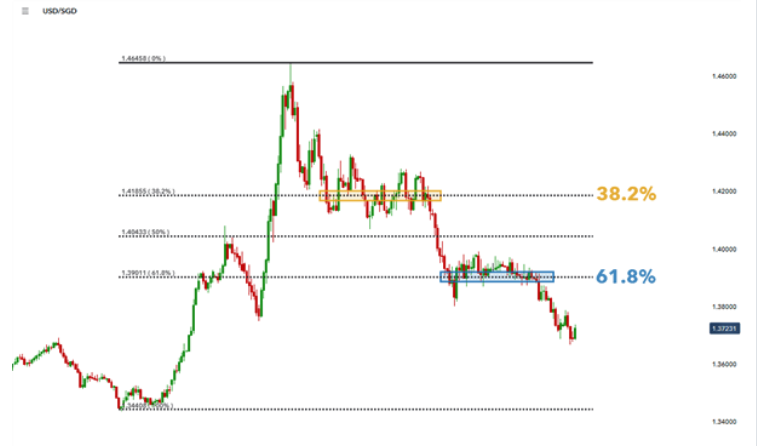
From the top, the drawing tool shows ‘price action’ struggling to make a clear directional break below the 38.2% level – the opposite of 61.8% (1 – 0.618). The price is only around until a decisive break towards the 61.8% level which acts as support.
Read Too :
- Premium Binary Bot Free Downloads – Higher Lower Bot 2022
- Binary Bot XML – G7 Analyzer Digits Over Under Bot 2022
- Binary Trading Bot Downloads – No martiangle PUT CALL 2022
- Digit Differ Bot Free Downloads – Differ Twin XX YY Wih Martiangel 2022
This example shows how the 38.2 and 50 percent levels are less significant than the 61.8% levels – which act as key support levels. While Fibonacci levels are imperfect, meaning price action may move through defined levels, they are still a very useful indicator that reveals where a particular market may be experiencing support and resistance or consolidating before breaking a new trend.