Moving Average Convergence Divergence (MACD) is an indicator in technical analysis that describes the relationship between two moving averages in an asset price trend. Meanwhile, the moving average itself is the average price, either opening or closing trades every day, which is depicted in a trend line.
So, what is the use of the MACD indicator? MACD itself is used by traders to understand when the price of the asset will be bullish or bearish.
MACD is a technical analysis created in 1979 by Gerard Appel. Over the years, this indicator has been favored by traders all over the world because of its simplicity and flexibility. This is because this indicator can be used both to see trends and momentum. Hence, MACD is often used by traders in the stock, bond, commodity and foreign exchange markets.
Get to know MACD more deeply
The concept of MACD can be confusing, although its meaning and purpose are actually very easy to understand. Basically, MACD calculates the Exponential Moving Average (EMA) for the last 12 days and 26 days. EMA itself is a type of moving average that focuses on the weight and significance of the most recent data.
In short, this is the formula for MACD:
MACD = 12-day EMA – 26-day EMA
Thus, the MACD will be positive if the 12-day EMA is greater than 26 days, and will be negative if the conditions are reversed.
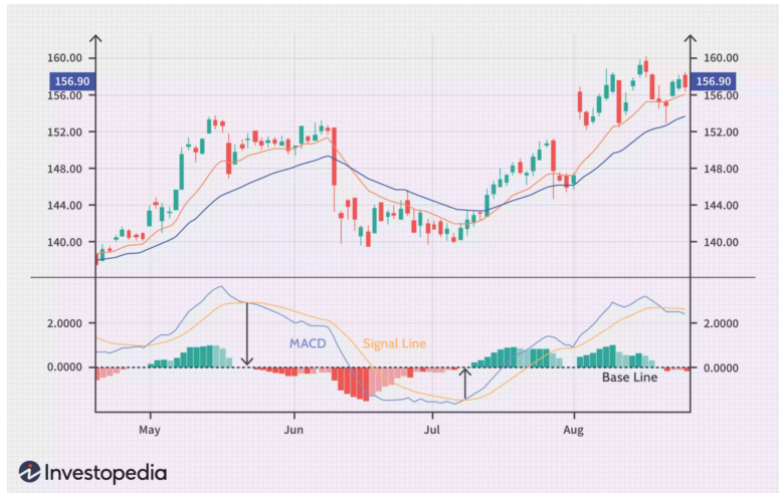
Then, the results of these calculations will form a line called the MACD line. Usually, the line will be juxtaposed with the EMA calculated for nine days which is referred to as the “signal line”. This signal line will be placed above the MACD line to give traders a hint in buying or selling the asset. As seen in the graph below.

Moving Average Convergence Divergence (MACD)
MACD Type
Traders usually recognize two types of MACD in technical analysis, namely crossover and divergence. Crossover is the art of seeing the trend of the MACD line compared to the signal line. An asset price will enter the bearish zone if the MACD line crosses below the signal line. Which means, traders must immediately release their assets.
Meanwhile, a bullish signal will occur if the MACD line crosses above the signal line, indicating that traders should rush to buy the asset.
Some traders will jump into action when the MACD line moves quickly to the signal line, either going down or up. However, others choose to act after the MACD line actually crosses the signal line in order to avoid the “trap”. However, the crossover result will be more reliable if it repeats the trend that has occurred before.

Moving Average Convergence Divergence (MACD)
The following is an example of a crossover indicating a bullish signal.
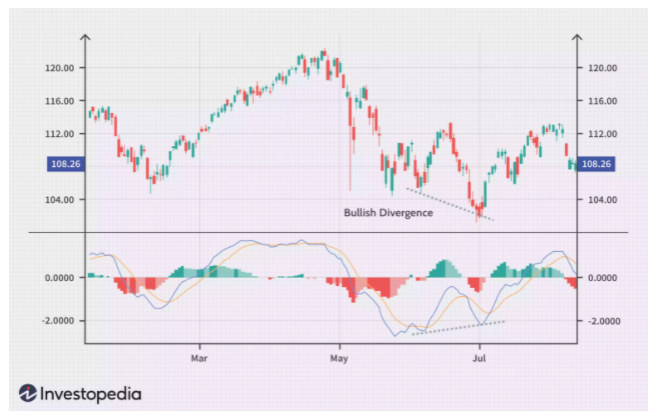
Meanwhile, divergence is a condition where the MACD line forms the highest and lowest points opposite the highest and lowest points of the asset’s price. A bullish condition will be created if the two lows on the MACD line correspond to the two bottom lines in the asset price. Here is an example.
MACD is the ‘Friend’ of RSI
In technical analysis, usually traders will always read the MACD indicator along with the Relative Strength Index (RSI) to determine market entry and exit strategies. However, is the MACD similar to the RSI indicator?
RSI is an indicator that shows fluctuations in the price of an asset. This indicator can give a signal whether an asset is in the area of overbought (overbought) or oversold (oversold) against its current price position. The RSI is calculated by dividing the average price increase or decrease over a certain time span, which usually has a 14 day period with a value range of 0 to 100.
So, in terms of calculations, MACD and RSI are certainly different. MACD looks at the relationship of the two EMAs, while the RSI calculates the price change data.
These two indicators are indeed often used by analysts to see the complete condition of a market. However, it is not uncommon for both of them to produce market indications that are different from each other. The RSI indicator can be at a high number, or the market is overbought, even though the MACD indicates a buying moment. Vice versa.
‘False Hope’ Is A Shortcoming Of MACD
Like other technical analysis, the use of MACD is not without its drawbacks. In this case, the main drawback of MACD is that it always shows a signal of a reversal of the price trend, but in fact the prediction fails to happen. In other words, MACD often predicts false positive conditions.
This event often occurs when the price of an asset moves in a consolidation phase, or looks for a new price movement.
MACD Trading Strategy: 3 Steps To Find The Trend. One way of simplifying trading strategies is through trading plans that include reliable indicators such as MACD. This article will discuss MACD, Moving Average Convergence/Divergence trading strategies and how they can be used to identify trend direction and momentum.
MACD Trading Strategy To Find And Enter The Trend
Spotting trends is arguably one of the most important steps all technical traders have to take in their trading and while it may seem like a difficult task, MACD can be very useful in this regard.
Three steps to find and enter a trend using MACD:
- Identify trend direction
- Using MACD crossover for opportunities in the direction of the trend
- Using MACD zero line to manage risk
1. Identify Trend Direction
One way for traders to identify trends is to use a 200-day moving average. If a trader wants to enter a long position, they can use the 200-day moving average on the price chart to determine if price is consistently trading above the average range.
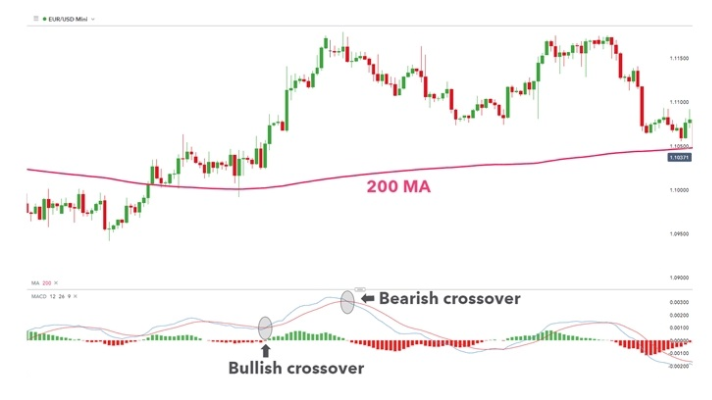
In the example below, the EUR/USD chart shows a prevailing uptrend which is confirmed by price consistently trading above its 200-day moving average. If this happens, the trader can proceed to the second step to determine the possible entry points.
2. Using MACD crossover to see trend direction opportunities
Once a trading bias is established, traders will start looking for buy signals in the same direction as the current trend. In the chart above, when the price is above the 200-day moving average, the MACD crossover can be used for potential entry signals.
As outlined on the chart, a trader can look to enter a long position on the first highlighted MACD crossover. At this point the MACD line (blue line) is above the signal line (red line) and the price is still trading above the 200-day MA.
3. Use MACD zero line to manage risk
When trading a trend, it is important to know that the trend will eventually end. In an uptrend like EUR/USD, when a bearish crossover occurs, this could be a sign that the uptrend momentum is slowing and may possibly change direction.
A trader with a long position can be prepared to exit the position at this point, although it could be only a temporary decline. When a bearish cross occurs, traders can look for a signal line if it breaks below the zero line, which confirms a downtrend. At this point the trader can release the position and exit the trade.
MACD Trading Strategy To Identify A ‘saturated’ Trend
Trend following strategies are popular among both new and experienced traders. The majority of traders enter a trade at the end of a trend only to see the trend reverse. Can the MACD trading strategy help traders find the saturated trend earlier?
A good way to identify trend changes is with MACD divergence. Divergences usually occur when the indicator moves in a different direction from the price indicating that the trend’s momentum is slowing down.
Below we can see the German DAX 30 index forming higher highs on the price chart, while MACD is making lower highs, this is a divergence. This is the first indication that the price momentum of the current trend is slowing down. At this point, the trader should consider reducing and possibly closing all existing long positions.
Once the divergence is identified, the trader can then look for execution using the classic MACD crossover. Traders who have entered long positions can exit the trade on the next bearish cross (where the blue MACD line crosses below the red signal line in a downtrend), protecting the trader from losses that could occur in the event of a reversal.
Although the MACD trading strategy is often used to identify possible entry triggers, it is also effective for determining exit triggers as seen in divergences. While time of entry is very important, risk management should not be neglected.
MACD Trading Strategy FAQ:
Is there a faster method to enter a trade using the MACD indicator?
While MACD crossovers are the most popular method of determining entry signals, MACD histograms can be used as an alternative method and are often used by less conservative traders.
What other indicators are useful when entering trades with MACD?
While indicators, such as MACD are good tools to use, client sentiment can be used as an additional tool to assess how other traders react to the market. By combining these methods, traders can get a holistic view of the market and can then use MACD to determine possible entry and exit points.
