16 Most Popular and Profitable Candlestick Patterns. Fluctuating stock movements certainly require careful and precise steps to minimize losses. One way for investors to predict prices in the stock market is to use candlestick patterns. This technique serves to map the rise and fall of prices in the money market, ranging from stocks to cryptocurrencies.
The candlestick pattern itself is a type of price chart that traders use to see the high, low, open, and close security prices at certain periods. In its implementation, there are many candlestick patterns that can be considered.
Read Too :
- Premium Binary Bot Free Downloads – Higher Lower Bot 2022
- Binary Bot XML – G7 Analyzer Digits Over Under Bot 2022
- Binary Trading Bot Downloads – No martiangle PUT CALL 2022
- Digit Differ Bot Free Downloads – Differ Twin XX YY Wih Martiangel 2022
Knowing the various candlestick patterns will help you to know which patterns are potentially profitable and minimize the risk of loss. Through this candlestick pattern, traders can monitor the current price movement. Come on, see the article for various candlestick patterns.
Single Candlestick Pattern
Single candlestick patterns are the easiest candlesticks to find because they only have one segment or do not have pairs. There are several types of single candlestick patterns, namely:
Marubozu
Marubozu is a type of single candlestick pattern which means “bald head”. Marubozu has the form of a body candle that has no upper and lower shadows. The existence of Marubozu is a sign that the bearish or bullish pressure is very large at certain periods.
Read Too :
- Premium Binary Bot Free Downloads – Higher Lower Bot 2022
- Binary Bot XML – G7 Analyzer Digits Over Under Bot 2022
- Binary Trading Bot Downloads – No martiangle PUT CALL 2022
- Digit Differ Bot Free Downloads – Differ Twin XX YY Wih Martiangel 2022
Bearish candlesticks are usually marked in black while bullish will be marked with white candlesticks. If you see a bullish Marubozu, it means that the bullish pressure is strengthening.
In addition, Marubozu is also considered the most profitable candlestick pattern if there is a bullish trend. However, if a bearish Marubozu appears, it means that the bearish pressure is very strong.
Long Candle
Long candle is one of the typical candlestick patterns with its length. Similar to Marubozu, this pattern consists of a Long Bullish Candle and a Long Bearish Candle. The difference lies in the shadow where Long Candle has a clearer shadow while Marubozu does not have it.
Spinning Tops
The next candlestick pattern is Spinning Tops which has an upper and lower shadow with a length on the top and bottom. However, the size of this candlestick pattern is relatively small. This indicates that the influence of bearish and bullish is the same.
You need to know that the market is likely to experience a downtrend if the Spinning Tops appear at the end of the uptrend. Meanwhile, the market is likely to experience an uptrend if this candlestick appears at the end of the downtrend.
Read Too :
- Premium Binary Bot Free Downloads – Higher Lower Bot 2022
- Binary Bot XML – G7 Analyzer Digits Over Under Bot 2022
- Binary Trading Bot Downloads – No martiangle PUT CALL 2022
- Digit Differ Bot Free Downloads – Differ Twin XX YY Wih Martiangel 2022
Doji
Doji is a candlestick pattern that has a thin shape like a line as a result of the same open and close prices. This candlestick has a pattern with complex characteristics, so confirmation of the next candlestick pattern is needed so that it is easier for you to predict the direction of the market. The Doji pattern itself is divided into several types, namely star doji, long-legged doji, dragonfly doji, gravestone doji, and four price doji.
Hammer and Hanging Man
The Hammer and Hanging Man pattern has a short form with a long lower and short upper shadow. Although the Hammer and Hanging Man patterns are often considered to have low accuracy, they still play an important role in projecting changes in market forces before the trend changes.
When the price falls, the hammer signals that the price opens and closes in adjacent levels. Meanwhile, when the hammer is formed when the price is rising, the long wick will signal a strong seller push.
Double Candlestick Pattern
If single candlestick patterns have only one segment, then double candlestick patterns consist of two segments. There are several kinds of double candlestick patterns which include the following:
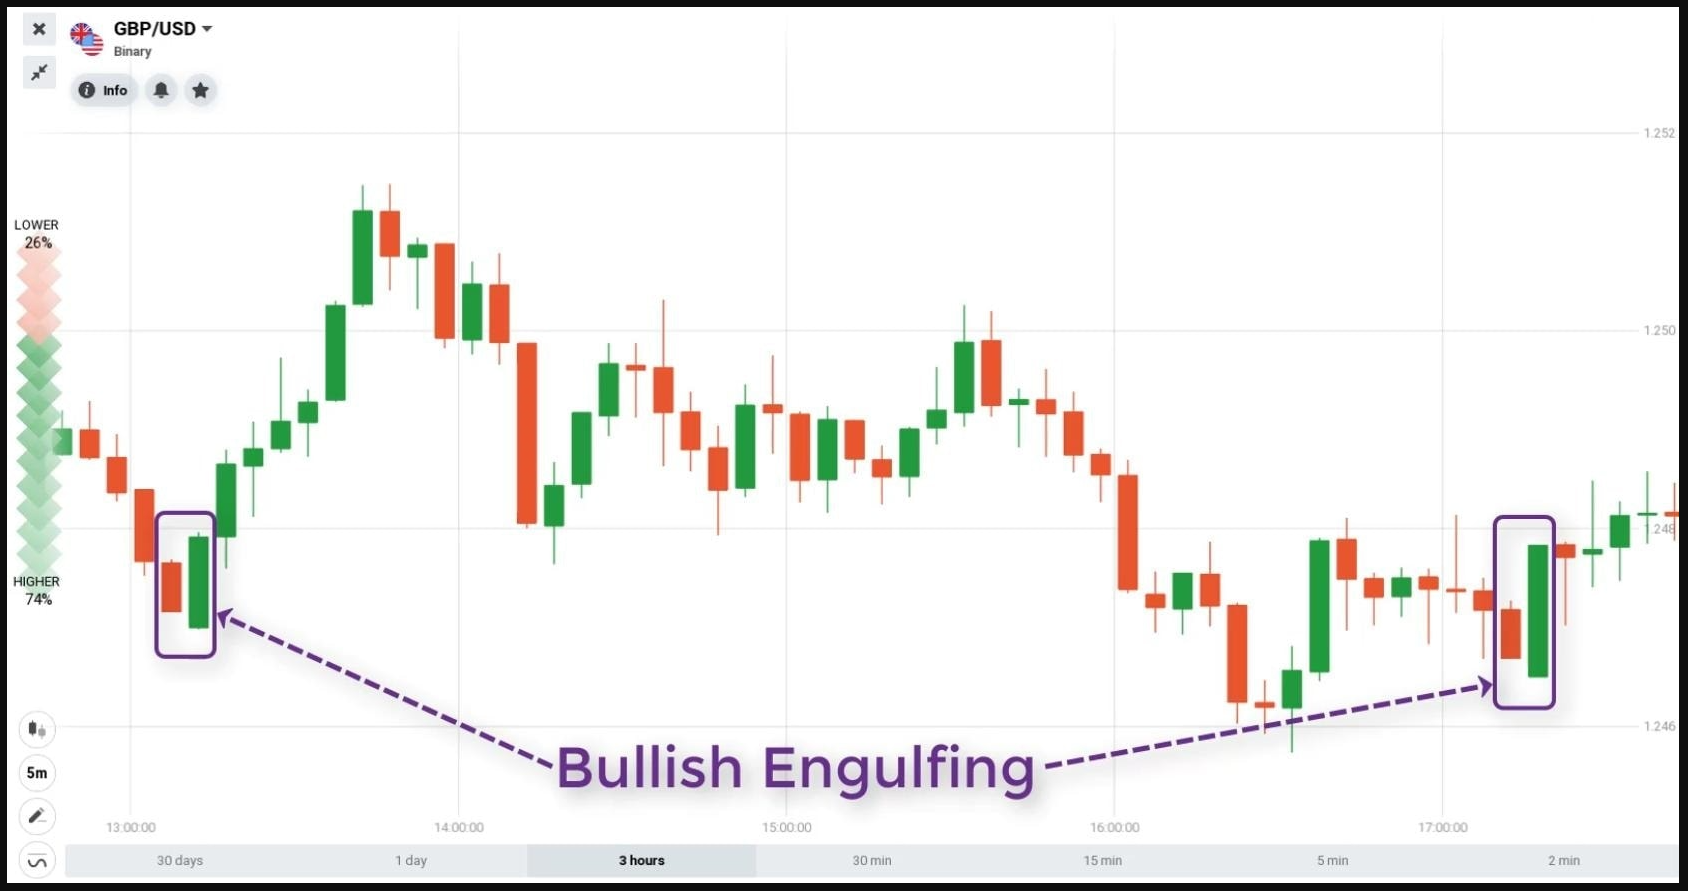
Engulfing Pattern
The Engulfing Pattern is a candlestick pattern that is easier for traders to observe, where the probability of trading with this pattern is quite high, especially in trending market conditions. Therefore, not a few traders who then get profit through this pattern as a sign for entry.
Read Too :
- Premium Binary Bot Free Downloads – Higher Lower Bot 2022
- Binary Bot XML – G7 Analyzer Digits Over Under Bot 2022
- Binary Trading Bot Downloads – No martiangle PUT CALL 2022
- Digit Differ Bot Free Downloads – Differ Twin XX YY Wih Martiangel 2022
This candlestick pattern is divided into two types, namely bullish engulfing and bearish engulfing. You can find this pattern by the presence of a candlestick that is longer than the previous candlestick.
Harami
Harami is taken from the Japanese language which means “pregnancy” because the shape of this pattern has two candlesticks. The second trunk always has a smaller size and is located within the reach of the first trunk. This candlestick is the opposite of the Engulfing Pattern.
The presence of bullishness in Harami can be identified by the appearance of a smaller candlestick than the previous candlestick which is a bearish candlestick. Meanwhile, bearish harami can be identified by the appearance of a bearish candlestick that is smaller than the previous candlestick.
Dark Cloud Cover And Piercing Line
Dark Cloud Cover is a bearish pattern, while Piercing Line is a bullish pattern. These candlestick patterns are no less popular than other patterns and are able to help make it easier for you to determine the entry location.
A pattern can be called a bearish Dark Cloud Cover if the price of the bearish high candlestick is higher than the price of the previous high bullish candlestick; the close price of the bearish candlestick is lower than the close price of the previous bullish candlestick; and the length of the bearish candlestick is at least half of the length of the previous bullish candlestick.
Read Too :
- Premium Binary Bot Free Downloads – Higher Lower Bot 2022
- Binary Bot XML – G7 Analyzer Digits Over Under Bot 2022
- Binary Trading Bot Downloads – No martiangle PUT CALL 2022
- Digit Differ Bot Free Downloads – Differ Twin XX YY Wih Martiangel 2022
It is called a Piercing Line if the low price of the bullish candlestick is lower than the low price of the previous bearish candlestick. In addition, the price of the close of the bullish candlestick must be higher than the price of the close of the previous candlestick and the length of the body of the bullish candlestick is at least half of the length of the body of the previous bearish candle.
Tweeter
As the name implies, the shape of the Tweezer candlestick pattern is almost the same as a clamp. This tweezer is usually located at the top and bottom with patterns that indicate a trend reversal. Even so, sometimes this pattern also requires additional candles to confirm the signal.
The Tweezer pattern is divided into Tweezer Top and Tweezer Bottom. The Tweezer Top is a side-by-side hammer shape. Meanwhile, Tweezer Top is an inverted hammer side by side.
Triple Candlestick Pattern
The accuracy of triple candlestick patterns is the highest, so it is widely used by traders. There are three types for this pattern, namely:
Morning Star and Evening Star
The Morning Star and Evening Star patterns are supported by a longer correction compared to other candlestick patterns.
So it is not surprising that this candlestick pattern is widely used by traders to compete for profit. The Morning Star is an indication of bullishness while the Evening Star is an indication of bearishness.
On the Morning Star, the first candlestick is a bearish indicator that is part of a downtrend. The second candlestick has a smaller body which can be a bullish or bearish indicator.
Read Too :
- Premium Binary Bot Free Downloads – Higher Lower Bot 2022
- Binary Bot XML – G7 Analyzer Digits Over Under Bot 2022
- Binary Trading Bot Downloads – No martiangle PUT CALL 2022
- Digit Differ Bot Free Downloads – Differ Twin XX YY Wih Martiangel 2022
This is a sign of doubt in the market. Moreover, in the third candlestick is a longer bullish indicator than the second.
The Evening Star pattern can be marked by the first candlestick which is a bullish indicator as part of an uptrend. Then, the second candlestick has a smaller size, neither bullish nor bearish is considered important. In addition, the third candlestick is a longer bearish indicator compared to the second candlestick.
Three White Soldiers And Three Black Crows
These two candlestick patterns are part of the reversal pattern category. That is, if the formation that is formed is complete, then the price is expected to change direction from the previous trend.
If the previous price was bullish, it will turn down to be bearish. Meanwhile, if the previous price was bearish, it will move up towards the bullish direction.
To make it easier for you to tell the difference, Three White Soldiers is considered the most profitable candlestick pattern signal.
This means that the bullish trend is expected to strengthen. Especially if this pattern appears when the downtrend enters the consolidation phase.
In general, this phase occurs when prices tend to move sideways. On the other hand, the Three Black Crows pattern is a bearish pattern that is known for having three consecutive bearish candlesticks when an uptrend occurs.
Three Inside Up And Three Inside Down
The Three Inside Up pattern indicates that there is a potential for a bullish reversal to occur in a reversal, where the price will reverse up after continuing to decline. In general, this candlestick pattern indicates a downward trend where a downtrend is the initial possibility of an uptrend.
Read Too :
- Premium Binary Bot Free Downloads – Higher Lower Bot 2022
- Binary Bot XML – G7 Analyzer Digits Over Under Bot 2022
- Binary Trading Bot Downloads – No martiangle PUT CALL 2022
- Digit Differ Bot Free Downloads – Differ Twin XX YY Wih Martiangel 2022
From this pattern you can know when to make a sale. Meanwhile, Three Inside Down is an indicator that is intended for a downtrend reversal.
Pinbar Pattern
The types of patterns on the Pinbar are considered the most profitable candlestick patterns because they often appear on charts. In addition, the Pinbar pattern type is also more easily recognized by traders with its distinctive shape, namely a shadow that is longer than the body and tip of the opposite shadow.
The longer the shadow compared to the body and nose (opposite), the higher the possibility of a reversal or trend continuation. The formation of the Pinbar pattern actually indicates the occurrence of market sentiment. At first the market value was led in one direction and then reversed and this will leave a long shadow trail.
Inside Bar Pattern
The Inside Bar pattern often appears when the trend has reached a high or low. Through this pattern, you can find out the characteristics of the two candlesticks, where one of the bars is smaller and is located between the range of the parent bar.
Multi Bar Reversal Pattern
The Multi Bar Reversal pattern has many candles in one formation so it rarely appears. Even so, this pattern can still be relied on because of the higher level of accuracy of trading signals when compared to other candlestick patterns.
Read Too :
- Premium Binary Bot Free Downloads – Higher Lower Bot 2022
- Binary Bot XML – G7 Analyzer Digits Over Under Bot 2022
- Binary Trading Bot Downloads – No martiangle PUT CALL 2022
- Digit Differ Bot Free Downloads – Differ Twin XX YY Wih Martiangel 2022
The hallmark of this pattern is the three bars or bars that are in the middle but opposite to the last bar. The last candle can determine the accuracy of this pattern only at the close. In addition, this pattern will provide confirmation of a bullish reversal after the last bar closed lower than the first bar.
Those are the various candlestick patterns that often appear and can be your reference for observing stock price movements. The world of stocks is a lucrative and risky business field. Equipping yourself with some important knowledge, such as candlestick patterns is one way to minimize these losses.